Since peaking in July, both the Nasdaq and S&P 500 have struggled for direction.
The market’s constant rotation between value and growth stocks has been a key reason for that.
One stock straddles both camps – the U.S.’s largest liquified natural gas producer and exporter, Cheniere Energy (LNG).
Its recent peak in August is a more than sixfold increase in its stock price since March 2020.
Yet despite smashing Q2 net income forecasts and raising forward guidance, LNG is trading at a low price-to-earnings (P/E) ratio of around 4.8. That’s around half of the sector it trades in.
After trading sideways for the first half of 2023, LNG rallied strongly through August.
But it has since become stuck in a sideways range again. So today I want to see what’s in store from here…
A Consolidating Triangle Pattern
LNG sold off heavily in December last year but initially rebounded in early January. Yet that rally was short-lived:
Cheniere Energy (LNG)
Source: eSignal
After initially rallying from oversold territory (lower grey dashed line), the Relative Strength Index (RSI) couldn’t break through resistance (green line).
This means there wasn’t enough buying momentum to drive LNG higher.
Instead, the RSI stayed stuck in its lower band (orange circle). And LNG continued to drift.
Apart from a brief burst higher in late February and March, the RSI remained in its lower range until June. The longer momentum dwindles like this, the more difficult it becomes for a stock to rally.
Only when the RSI finally broke through resistance and into its upper range in June did LNG’s rally get underway. That rally saw LNG gain as much as 26% in a little over two months.
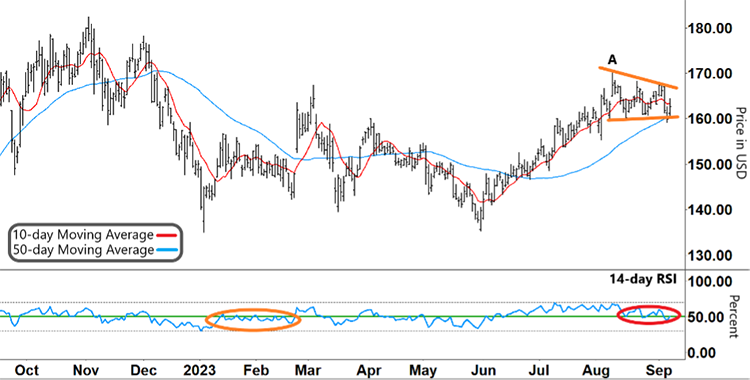
The 10-day Moving Average (MA, red line) bullishly crossing above the 50-day MA confirmed the rally. And both MAs then tracked higher.
But after hitting that peak at ‘A,’ the 10-day MA shows that LNG started to consolidate into a sideways pattern.
This converging triangle pattern is marked by a series of lower highs (upper orange line) on the upside… and LNG bouncing off short-term support (lower orange line).
Take another look:
Cheniere Energy (LNG)
Source: eSignal
When a stock breaks out of a triangle pattern like this, it can often lead to a big move.
The other thing to note is that the pattern is unfolding right as the RSI has again been retesting support (red circle).
So what should we look out for next?
Free Trading Resources
Have you checked out Larry’s free trading resources on his website? It contains a full trading glossary to help kickstart your trading career – at zero cost to you. Just click here to check it out.
Holding Short-Term Support
When the RSI gets stuck in its lower band, LNG has been unable to maintain momentum.
This happened in January through February and again from April through June.
So if the RSI falls through support and gets stuck in its lower half, LNG will also roll over and fall.
Both LNG and the RSI holding their support levels right now is key to any future rally.
If the RSI can rally into its upper range and LNG breaks through resistance (upper orange line), that could set off the next leg of LNG’s rally.
We’d then look for the 10-day MA to accelerate above the 50-day MA as further evidence of that up move.
Regards,
Larry Benedict
Editor, Trading With Larry Benedict
Mailbag
Where do you think LNG is headed in the coming days? Write in to [email protected].