After suffering a brutal fall last year, Tesla (TSLA) turned things around in the first half of 2023.
Swept along in this year’s big tech rally, the electric vehicle and battery manufacturer’s July peak represented a near-tripling of its January low.
But that strong surge pushed TSLA a long way into overbought territory.
With the market looking for a reason to sell, even a Q2 earnings beat in late July couldn’t sustain its rally. So TSLA gapped lower and continued to fall.
Yet buying momentum returned in August. Now TSLA is trying to rally once again.
With that rally in the balance, today I want to see how things might play out from here…
Doubling in a Month
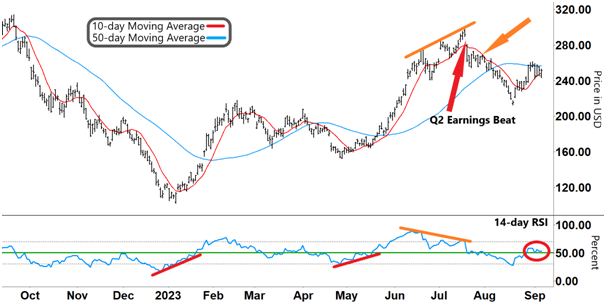
On the chart of TSLA below, you can see where its 13-month fall finished at the end of last year.
By the time it bottomed out, TSLA was trading at less than one-quarter of its November 2021 all-time high. That was a massive blow to investors.
Tesla (TSLA)
Source: e-Signal
But with an upswing in momentum in early January (left red line), TSLA soon began to turn things around.
TSLA’s up move accelerated with the Relative Strength Index (RSI) bullishly breaking into the upper half of its range.
By the first week of February, that strong momentum pushed TSLA to double from its January low. It also saw the 10-day moving average (MA, red line) cross above the 50-day MA (blue line) at almost right angles.
But the RSI showed that it was overbought (upper grey dashed line). TSLA rolled over and gently drifted lower before finding a new base in May.
This time, a repeat of the RSI pattern (right red line) from January set TSLA up for an even bigger move higher. It eventually topped out on July 19.
But even before TSLA announced its Q2 earnings beat, a common reversal pattern warned of a potential sell-off when we checked in on TSLA early last month (orange arrow).
While TSLA was rallying up to its yearly highs (upper orange line), the RSI was strongly trending lower (lower orange line) from a long way in overbought territory.
After posting those earnings, TSLA’s emerging down move then developed into something much bigger.
Take another look:
Tesla (TSLA)
Source: e-Signal
That coincided with the RSI crossing into the lower half of its band. That move bearishly dragged the 10-day MA back below the 50-day MA.
After the RSI rallied from oversold territory (for a third time) last month, TSLA is again trying to rally.
But now the RSI is stuck right around support/resistance and our two MAs are tracking closely together. So what am I looking for around here?
|
Free Trading Resources Have you checked out Larry’s free trading resources on his website? It contains a full trading glossary to help kickstart your trading career – at zero cost to you. Just click here to check it out. |
New Buyers Needed
One major reason tech stocks have sold down from their highs is that new buyers have been thin on the ground.
Even an earnings beat failed to maintain TSLA’s rally. That’s something that also occurred with tech giants like Apple and Microsoft.
So with the RSI tracking right around support/resistance, what happens next will be key.
If the RSI can hold support and remain in its upper band, that will increase the odds of TSLA’s rally turning into something bigger.
Another confirmation of that rally would be the 10-day MA crossing back above the 50-day MA and moving higher.
The next test for TSLA would then be to take out its July high.
Regards,
Larry Benedict
Editor, Trading With Larry Benedict
P.S. There’s not much time left to check out the 7-Day AI Blitz… and potentially double your money this week with this alternative AI play. My trade alert could go out at any time. And by Friday, this blitz will be over.
If you haven’t caught up on this story yet, please go ahead and watch the replay here now.