Tesla might be the perfect stock for trading volatility.
Over the past two months, the shares rallied as much as 31%… and dropped 25%. To say the least, Tesla’s stock is producing big moves.
The company’s products are at the cutting edge of several technology trends. That includes electric vehicles, fully autonomous driving, artificial intelligence, robotics, robotaxis, and supercomputers… just to name a few.
Tesla is also one of the largest corporate holders of Bitcoin. Its stake is valued at $1.3 billion.
The hype around any one of those trends is enough to send any stock into overdrive – let alone when all these trends speed up at the same time.
And let’s not forget about CEO Elon Musk. He went from being a fixture in Washington to sparring with President Trump on social media. Many blame Elon’s antics for the drop in car sales.
As you might expect, Tesla shares can be challenging to trade with all this commotion.
But a closer look reveals patterns that can help tip Tesla’s next move…
A Roller Coaster Ride
Tesla stock is notorious for taking investors on a roller coaster ride.
For instance, the stock rallied 91% in the aftermath of last year’s elections, as Elon’s proximity to the president looked like a good thing.
Then shares crashed by 54% into the April lows as the trade war took its toll across the market.
While TSLA’s moves look extreme, being able to interpret the chart action has tipped off several big moves in the stock.
That includes the recent whipsaws. Take the April lows, for example.
The Relative Strength Index (RSI) flagged a reversal higher was in store as stocks sold off on tariff headlines.
The RSI measures underlying price momentum and started to make a positive divergence. Take a look at the chart below.
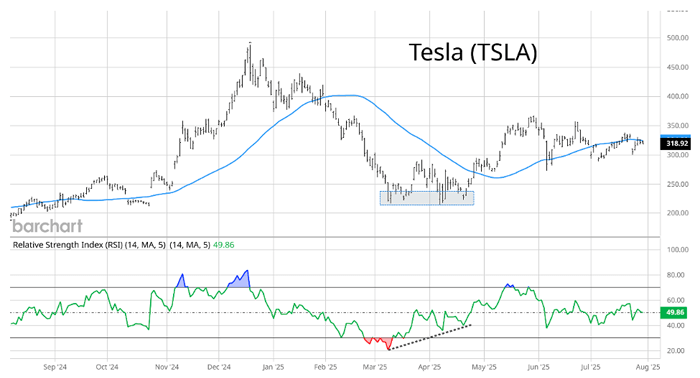
As TSLA came back to test the $220 price area (shaded box), the RSI was making a higher low (dashed line). That showed improving price momentum, and TSLA subsequently went on a 63% rally into late May.
But that’s not the only RSI divergence to tip a move. The RSI also hinted that TSLA’s rally into May was on borrowed time. Take another look at the chart:
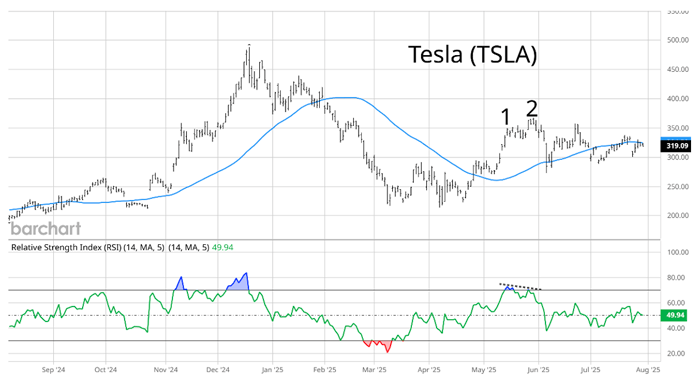
As TSLA moved to a new high from “1” to “2,” the RSI made a lower high. That negative divergence led to a 21% drop in just a week.
While investors are fixated on the headlines to explain every pop and drop in TSLA’s share price, being able to interpret the chart and price action can put the trading odds in your favor.
That’s why you should pay close attention to a new pattern pointing to an even bigger move in store.
|
Tune in to Trading With Larry Live
Each week, Market Wizard Larry Benedict goes live to share his thoughts on what’s impacting the markets. Whether you’re a novice or expert trader, you won’t want to miss Larry’s insights and analysis. Even better, it’s free to watch. Simply visit us on YouTube at 8:30 a.m. ET, Monday through Thursday, to catch the latest. |
Coiling for a Big Move
The recent rallies and pullbacks in TSLA shares may look like random volatility.
But a new pattern is emerging among the erratic price action. TSLA stock is coiling in a tighter range… like a spring that’s being compressed.
Take one more look at the chart:
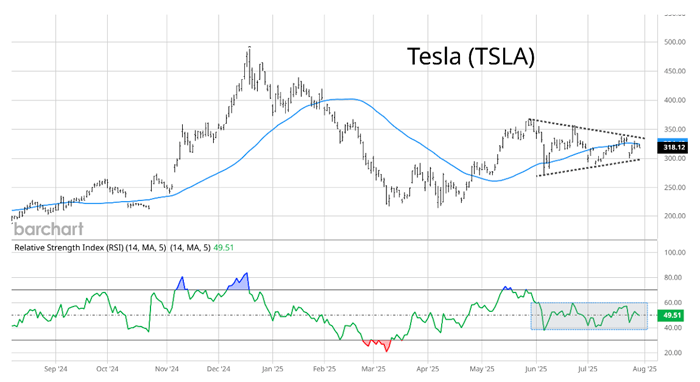
The dashed lines show the coiling price action that you must follow closely. The stock is nearing the apex of the triangle pattern, meaning it’s near a pivotal point.
A breakout in either direction from the triangle could produce the next big move in TSLA. You can also look to the RSI once again for confirmation.
As TSLA has been trading in a narrowing range since late May, the RSI has stayed rangebound between 40 on the downside and 60 on the upside (shaded box).
An RSI breakout from that range would confirm a move in the stock out of the triangle.
You may think TSLA shares are susceptible to headlines about things like AI, robotics, or Musk himself.
But bigger market forces are driving volatility in TSLA shares. Being able to interpret and understand the price action can lead you to profitable trading opportunities.
And there’s one more factor at play when Tesla sets up big moves like this. I call it a “glitch” because I don’t see it in any other stock I’ve looked at.
So if you’d like to learn more about this Tesla “glitch”… and if you’d like to follow along with my next Tesla trade recommendation… then simply go right here to watch.
Happy Trading,
Larry Benedict
Editor, Trading With Larry Benedict
|
Free Trading Resources Have you checked out Larry’s free trading resources on his website? It contains a full trading glossary to help kickstart your trading career – at zero cost to you. Just click here to check it out. |